Optimizing a Box of Crayons with Hierarchical Clustering and d3.js
October 18th, 2015
According to Wikipedia, there are 163 standard Crayola crayon colors. Variety is great, but having a box of this many crayons seems impractical. How can we reduce the number of crayons to produce a box that has fewer, but still distinct colors? How few colors can we have while still being representative of the full set?
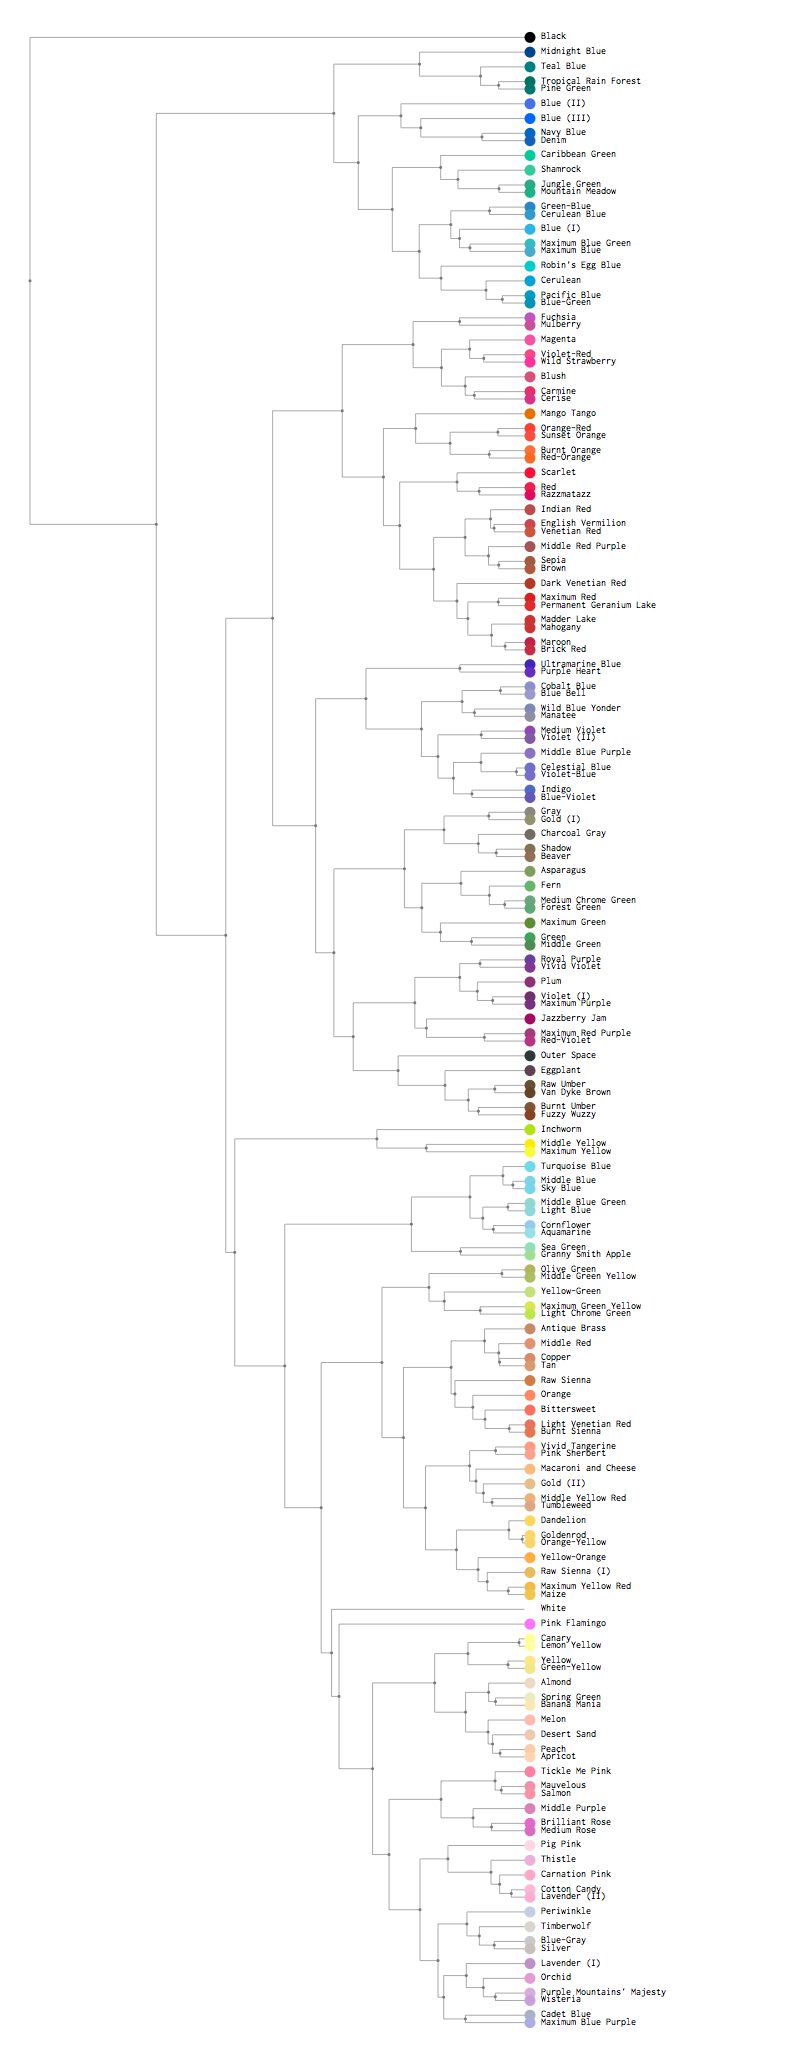
These questions can be answered or given guidance with a clustering algorithm such as k-means or hierarchical clustering. To solve our crayon problem, we will use agglomerative hierarchical clustering because it has an informative graphic representation in the form of a dendrogram(seen below) and it works in a way that is intuitive and similar to how we might manually solve this problem, that is by combining nearest colors into pairs first, then adding single colors or combining pairs which will help us answer our how few... question.
Explanations of the algorithm: 1, 2. Two main parameters are how to define distance between individual points and distance between clusters. For simplicity, we are using euclidean distance of RGB values and for the latter parameter we are using average distance between each cluster member.
Adjust crayon box:
Fewer crayons, larger clusters
More crayons, smaller clusters
The dotted vertical line on the graph denotes grouping, i.e. nodes directly under edges cut by this line are the root of each cluster. Crayon box colors are formed by averaging RGB values of cluster components.
All clustering is done clientside with help from a module that I authored: hcluster.js. It allows for adjusting distance(angular or euclidean, currently) and cluster distance(average, max, min) formulas and works well with d3 by using the d3 hierarchy json format. Pull requests welcome!
