Drought and Historical Rainfall in California
March 7th, 2014
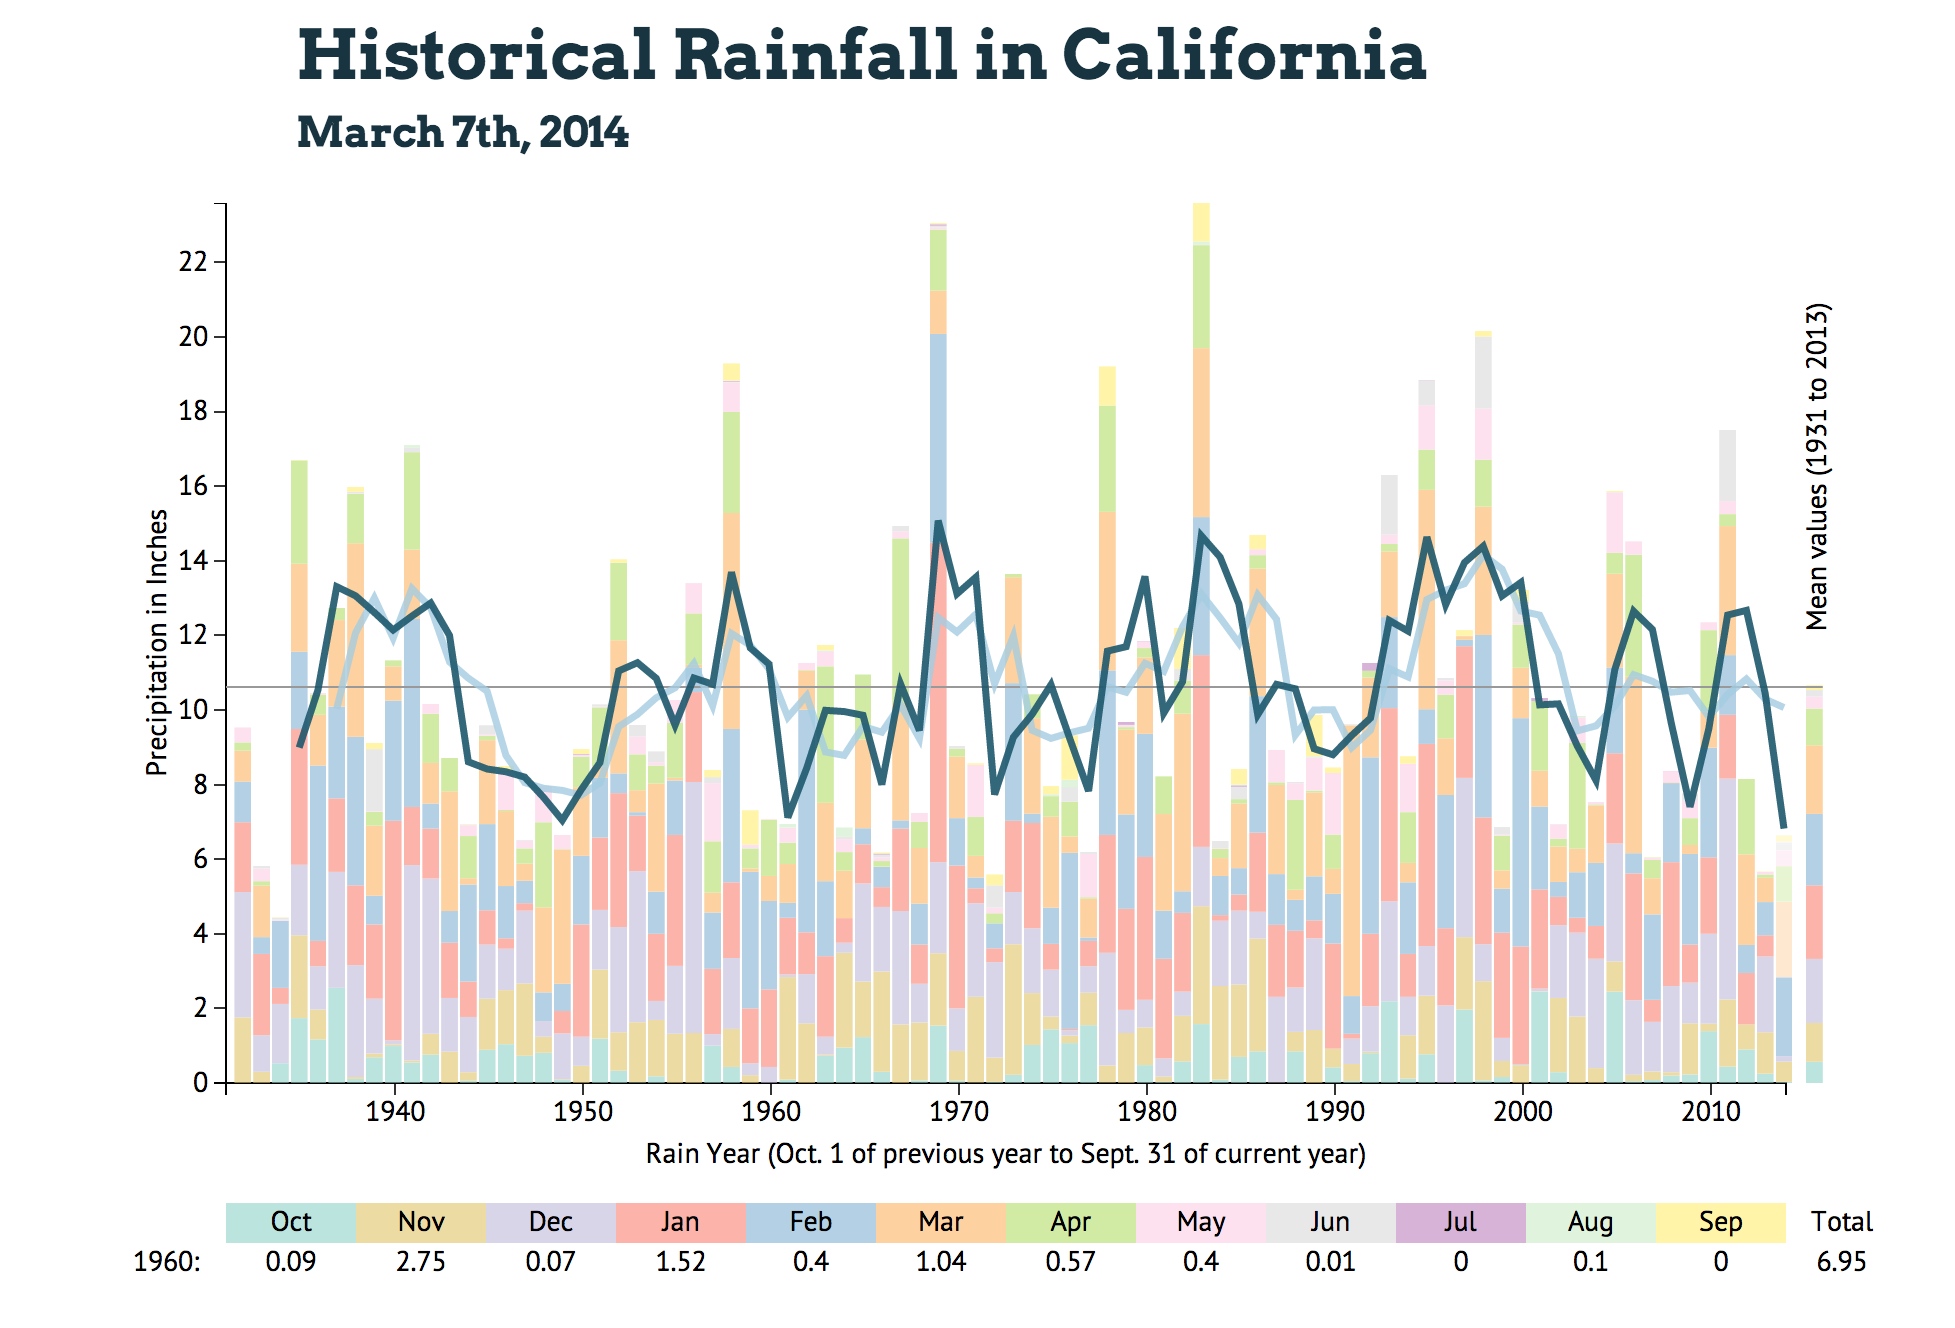
It's no mystery that California is in a state of drought. Reservoir levels are low[1] and water allocations to farmers and water districts are zero or near zero[2]. There are plenty of maps and images depicting the drought and its effects on the golden state. Here is a data visualization to analyze the relative scope of the current dry spell.
The data set is of precipitation in Fresno, California. Fresno was chosen because it is near the geographic center of California. The data is segmented by month and runs from 1931 through Feb. 2014.
The red line is on the total precipitation observed through Feb. 31(2.83"). This is 39% of the mean of previous years at the same time(7.21"). There are only three drier years since 1931 for the same time period(1947, 1948 and 1990).
The green line is the typical rainfall value through Feb.(mouseover different years to move).
The dark blue line is a 3 year moving average and the light blue line is a 5 year moving average. Moving averages are relevant because dry years have a cumulative effect; consecutive dry years deplete reservoirs and damage permanent crops, i.e. orchards and vineyards. The 3 year moving average (if we receive average rainfall for the rest of this rain year) is at a historic low(6.70"). The previous two water years have received 76% and 53% of the mean precipitation.
Yearly precipitation segmented by month in Fresno, CA
Note: this visualization looks best on a desktop or tablet.
