ByteMuse.com
The code and musings of @ChrisPolis
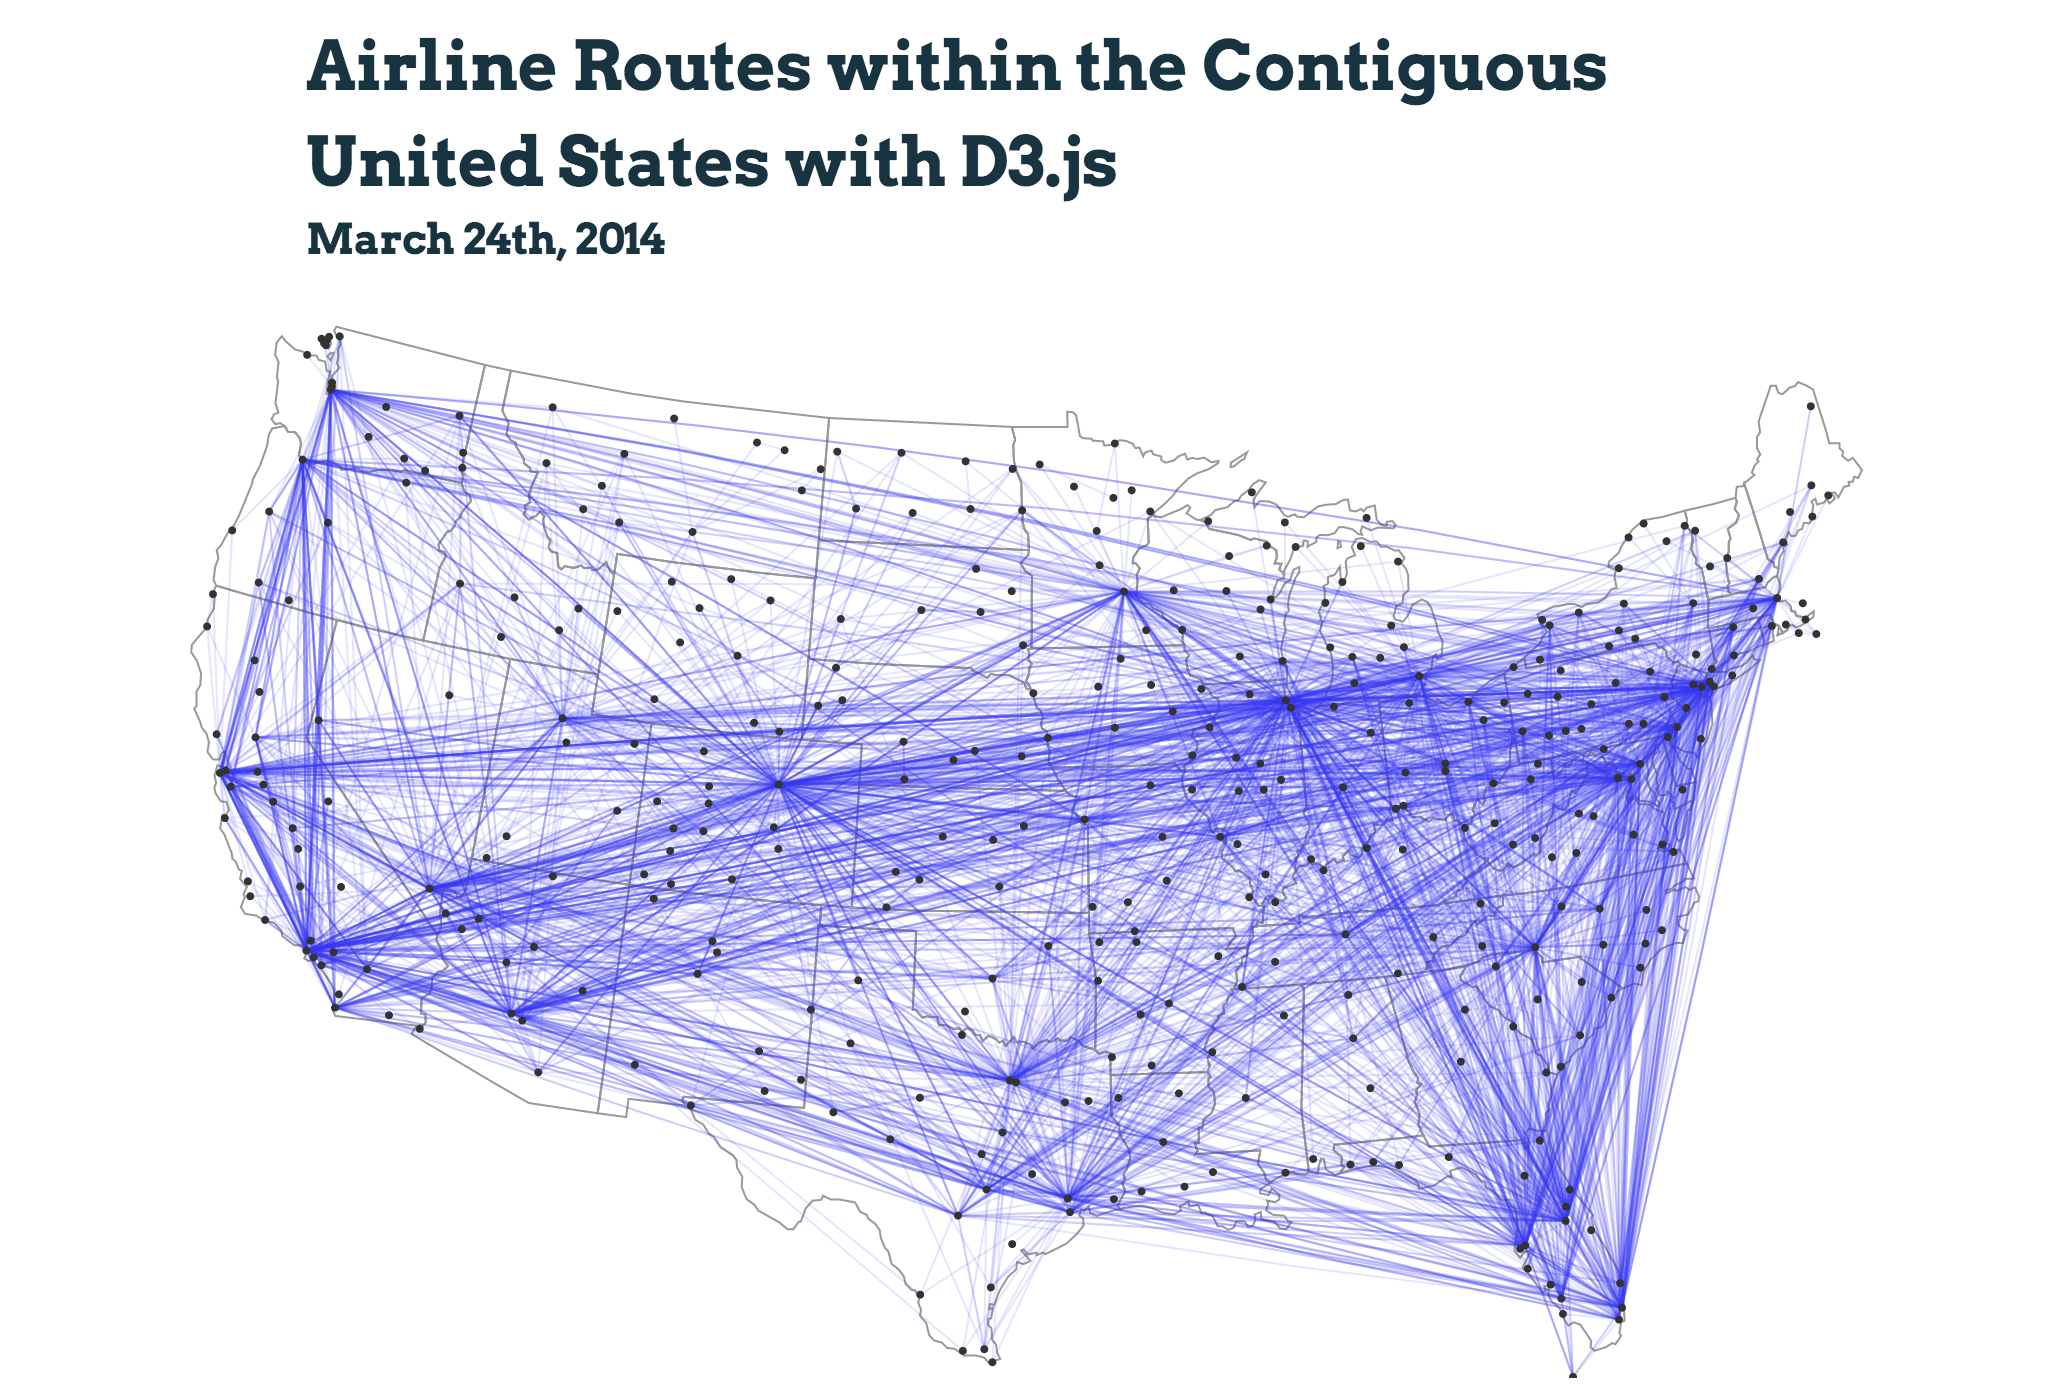
Data Source
Data was taken from OpenFlights.org on March 24th, 2014. The two files used are routes.dat and airports.dat. The data is well formatted, however its completeness is unknown.
Data Filtering
To minimize bandwidth and processing done by the client, a small Ruby script was used to filter routes and airports, while preserving the format of the original data files:
require 'CSV'
#
airports = CSV.read 'airports.csv'
routes = CSV.read 'routes.csv'
# Only show airports in cont. US
airports.select! do |a|
a[3] == "United States" and
a[6].to_f < 50 and # Lat < 50deg N (Omit Alaska)
a[7].to_f > -130 # Long > 130deg W (Omit Hawaii)
end
usIDs = airports.map(&:first)
routes.select! { |r| usIDs.include? r[3] and usIDs.include? r[5] }
# Only show airports with a route
airports.select! { |a| routes.any? { |r| r[3] == a[0] or r[5] == a[0] } }
#
File.open('us_airports.csv', 'w') { |f| f << airports.map(&:to_csv).join('') }
File.open('us_routes.csv', 'w') { |f| f << routes.map(&:to_csv).join('') }
Visualization Code: D3.js, CoffeeScript
This visualization is built with D3.js along with topojson and queue.js. The code is fairly terse and does the following: loads state, airport and route data, creates corresponding svg groups and populates them with path or circle elements as appropriate. Map point locations are calculated using d3.geo.projection and routes are drawn as great arcs.
#
buildMap = (error, stateData, airportData, routeData) ->
  width  = $('.container').width()
  height = width * 0.6

  #
  apLatLngs = {}
  for ap in airportData
    apLatLngs[ap.id] = ap.latLng = [parseFloat(ap.long), parseFloat(ap.lat)]

  #
  projection = d3.geo.albersUsa()
    .scale     width * 1.3
    .translate [width/2, height/2]
  path = d3.geo.path().projection(projection)

  #
  svg = d3.select('#routes-vis').append('svg')
    .attr 'width', width
    .attr 'height', height
  states   = svg.append('g').attr('id', 'states')
  routes   = svg.append('g').attr('id', 'routes')
  airports = svg.append('g').attr('id', 'airports')

  #
  states.selectAll('path')
    .data(stateData.features.filter((d,ndx) -> ndx != 1 and ndx != 11))
    .enter().append('path')
      .attr 'd', path
  airports.selectAll('circle')
    .data(airportData).enter()
    .append('circle')
      .attr 'cx', (d) -> projection(d.latLng)[0]
      .attr 'cy', (d) -> projection(d.latLng)[1]
      .attr 'r' , 2
  routes.selectAll('path')
    .data(routeData).enter()
    .append('path')
      .attr 'd', (d) ->
        path
          type: 'LineString'
          coordinates: [apLatLngs[d.src_id], apLatLngs[d.dest_id]]

queue()
  .defer d3.json, '/us_states.json'
  .defer d3.csv , '/us_airports.csv'
  .defer d3.csv , '/us_routes.csv'
  .await buildMap